Indian Journal of Science and Technology
DOI: 10.17485/IJST/v14i42.1004
Year: 2021, Volume: 14, Issue: 42, Pages: 3157-3176
Original Article
Mohit Soni1*, Rajesh Kumar Sharma1, Shivram Sharma2
1Department of Mathematics, Government Holkar Science College, Indore, M. P, India
2Government P. G. College, Guna, M. P, India
*Corresponding Author
Email: [email protected]
Received Date:02 June 2021, Accepted Date:10 October 2021, Published Date:10 December 2021
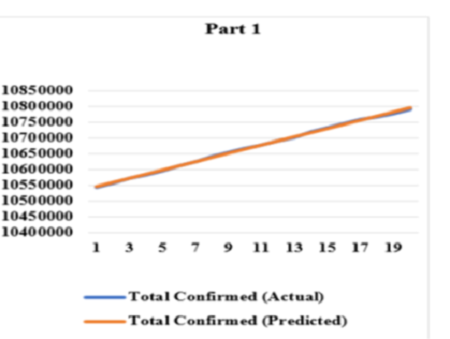
Objectives: Prevention measures play an important role in controlling infectious diseases. We eagerly want to know how to observe the impact of prevention measures, just by looking at the pandemic curve. To explain this impact, we observe that the graphical representation of an infectious disease on a logarithmic scale is more suitable compared to a linear scale. To achieve our result, we also verified that the curve of the cumulative confirmed cases of pandemic COVID-19 follows an almost exponential growth. Furthermore, we tested the flattening of the logarithmic curve, which indicates the effect of prevention measures are working well. Methods: We use the numerical and statistical method introduced by Baruh. We divided the cumulative confirmed COVID-19 data of 240 days into 12 equal parts (20 days per part) after the starting of the vaccination programme in India. We apply the exponential growth model to check the exponential growth of cumulative confirmed cases of COVID-19 on a linear scale and verify it by the comparison of the actual and the predicted values obtained by exponential model. Also, we compute the first difference of logarithmic cumulative confirmed cases and find its strong linear relationship with time ’t’. Furthermore, we apply the student t-test to confirm the linear relationship between them. We find the number of days require to flatten the logarithmic curve. Findings: Our results show that the uncertainty of the cumulative confirmed cases of COVID-19 spread pattern may continue in the upcoming days. The logarithmic curve would be flattened within 127 days from 23rd August 2021. The logarithmic scale explains the impact of the prevention measures better than the linear scale. Because the flattening of the logarithmic curve appears earlier than the flattening of the linear scale. Novelty: In the context of India, our study exhibits the importance of graphic presentation of COVID-19 data and compare between the logarithmic scales to the linear scale. As per our knowledge, this kind of study is new in the context of India.
Keywords: COVID-19; Exponential growth model; Linear regression; Student t-test; Cumulative confirmed cases; Logarithmic scale
© 2021 Soni et al. This is an open-access article distributed under the terms of the Creative Commons Attribution License, which permits unrestricted use, distribution, and reproduction in any medium, provided the original author and source are credited. Published By Indian Society for Education and Environment (iSee)
Subscribe now for latest articles and news.