Indian Journal of Science and Technology
Year: 2024, Volume: 17, Issue: 3, Pages: 258-269
Original Article
Sistla Ravi Kumar1*, Ch Ramasanyasi Rao2, Ch Prabhakara Rao3, V Sree Ramani4
1Associate Professor, Department of Physics, Vignan’s Institute of Information technology, Visakhapatnam, 530049, Andhra Pradesh, India
2Associate Professor & HOD, Department of Applied Mathematics, MVR Degree & PG College, Visakhapatnam, 530026, Andhra Pradesh, India
3Professor, Department of Mathematics (BS&H), Raghu Engineering college (Autonomous), Visakhapatnam, 531162, Andhra Pradesh, India
4Assistant Professor, Department of Mathematics, Chaitanya Bharathi Institute of technology, Gandipet, Hyderabad, 50007, Telangana, India
*Corresponding Author
Email: [email protected]
Received Date:08 October 2023, Accepted Date:22 December 2023, Published Date:13 January 2024
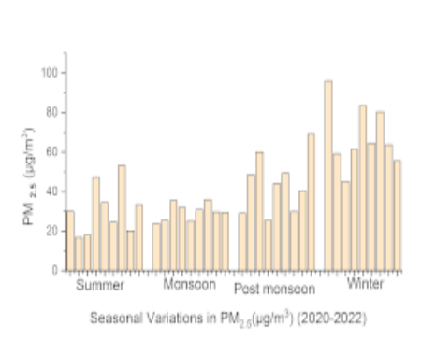
Objective: The main objective of the present study is to analyze the seasonal variations of major particulate air pollutants (PM2.5 and PM10) from January 2020 to December 2022 in the industrially developed Visakhapatnam City and its comparison with previous existing studies from January 2018 - December 2020. Methods: The real-time daily mass concentrations of air pollutants in Visakhapatnam recorded by the Central Pollution Control Board (CPCB) are collected for the present study. The monthly average observations of pollutants such as PM2.5, PM10, and PM2.5/PM10 in each season are considered for the present study, and pollutants trends are studied from January 2020 - December 2022. The fine particles below 100μm (RSPM) and coarse particles > 100μm (TSPM) are treated as primary pollutants and pollutant concentration is determined based on prevailing meteorological and topographic factors. In the present study, the pollutant intensity is analyzed using the Pearson correlation coefficient for various seasons. Similarly, statistical analysis is also implemented on particulate air pollutants (PM2.5 and PM10) from January 2020 to December 2022. Findings: From Table 1 PM2.5 levels fall within the range of 16 - 96 μg/m3 and the minimum PM2.5 level is in April 2020 and maximum in December 2020. According to AQI standards, moderate pollution indicates the fall of the PM10 levels within the range of 53-196 μg/m3 during 2020-2022 minimum in April 2020 and maximum in December 2020. The present study recorded high pollutants of PM2.5 and PM10 in Visakhapatnam in the winter season during 2020-2022. The obtained result reveals that high PM2.5 and PM10 mass concentrations in winter exceed the NAAQS limit and better air quality is observed especially in summer and during monsoon season. The ratio between PM2.5 and PM10 is minimal in May 2020 and almost similar maximum values from November - 2020 to December 2020. This indicates that PM10 concentration is maximum in May 2020 and minimum during November - 2020 to December 2020. The ratio between PM2.5 and PM10 is maximum in November 2021 and minimum in September - 2021. This indicates that PM10 concentration is less in November 2021 and maximum in September – 2021. The ratio between PM2.5 and PM10 is maximum in December 2022 and minimum in April - 2022. This indicates that PM10 concentration is less in December 2022 and maximum in April – 2022. The Pearson correlation coefficient between PMs over the period 2020-2022 is especially high in the summer season (r = 0.9711) and is negative (r= -0.7039) in the winter season which indicates that traffic-related emissions are the main sources of pollution at this site. Novelty: Air pollutants from January 2018 - December 2020 for nine monitoring stations in Visakhapatnam were observed by numerous authors and concluded that maximum PM2.5 levels fall within the range of 61-90 μg/m3. Similarly, PM10 falls within the range of 101-250 μg/m3 in 2019 and 2020. The maximum PM10 concentration was 195μg/m3 in December 2020 and the minimum value was 53μg/m3 in April 2020. The decrease in PM10 concentration is probably due to the prevailing pandemic situation in 2020. The major harmful air pollutant is particulate matter (PM10 and PM2.5) in Visakhapatnam city due to rapid industrialization and its variations are analyzed during January 2020 - December 22. The data analyzed from CPCB reveals that the maximum PM10 concentration was 166.5 μg/m3 in January 2021 and the minimum value was 74.92 μg/m3 in May 2021. The maximum PM2.5 concentration is 83.38 μg/m3 in January 2021 and the minimum value is 20.2 μg/m3 in April 2022. The decrease in P.M concentrations is probably due to the prevailing post-pandemic situation.
Keywords: Particulate matter, Dispersion, Pollution, Anthropogenic
© 2024 Kumar et al. This is an open-access article distributed under the terms of the Creative Commons Attribution License, which permits unrestricted use, distribution, and reproduction in any medium, provided the original author and source are credited. Published By Indian Society for Education and Environment (iSee)
Subscribe now for latest articles and news.